Dashboard View
This is the first view, which is visible as the user logs in to the system, this screen
has multiple data Indicators divided into sections.
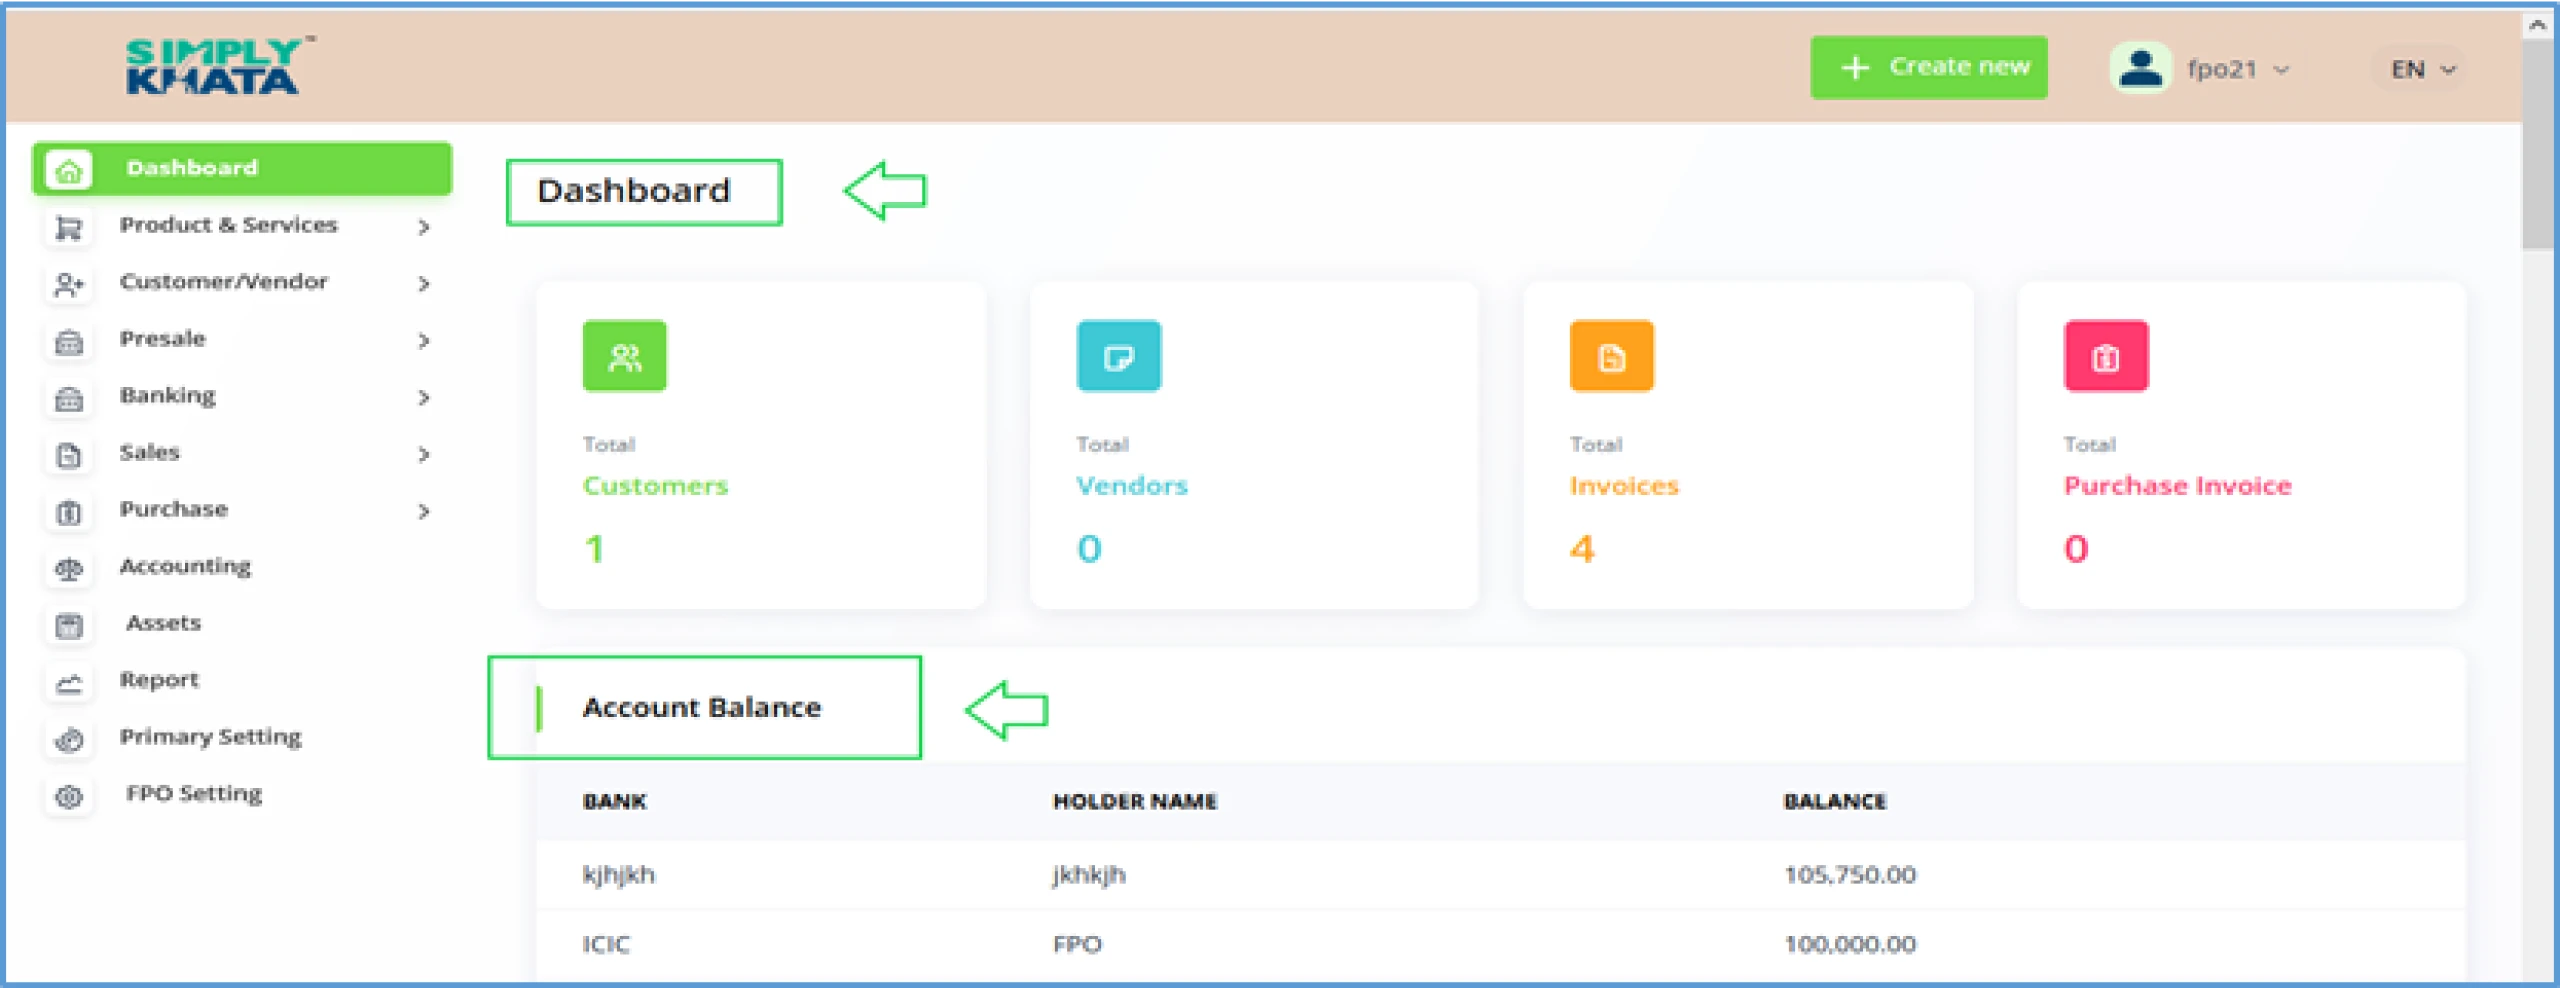
a. Dashboard: 1st and 2nd Section > Summary & Account Balance
This 1st section gives information about the main indicators of the business
like how many customers and Vendors FPO has.
- Customers > Number of Customers, The FPO has
- Vendors > Number of Vendors, The FPO has
- Invoices > Number of Invoices, The FPO issued
- Purchase Invoices > Number of Purchase Invoices, The FPO issued
This 2nd Section gives information about the bank account mapped in the system.
This section can contain multiple bank account details for summary view (Image - 18).
(Image -18)
b. Dashboard: 3rd & 4th Section> Cash-flow & Incomevs Expense
These sections give information about the cash flow of the FPO and income vs expenses.
These summary points (Cumulative) are available for daily and for current month.
(Image -19)
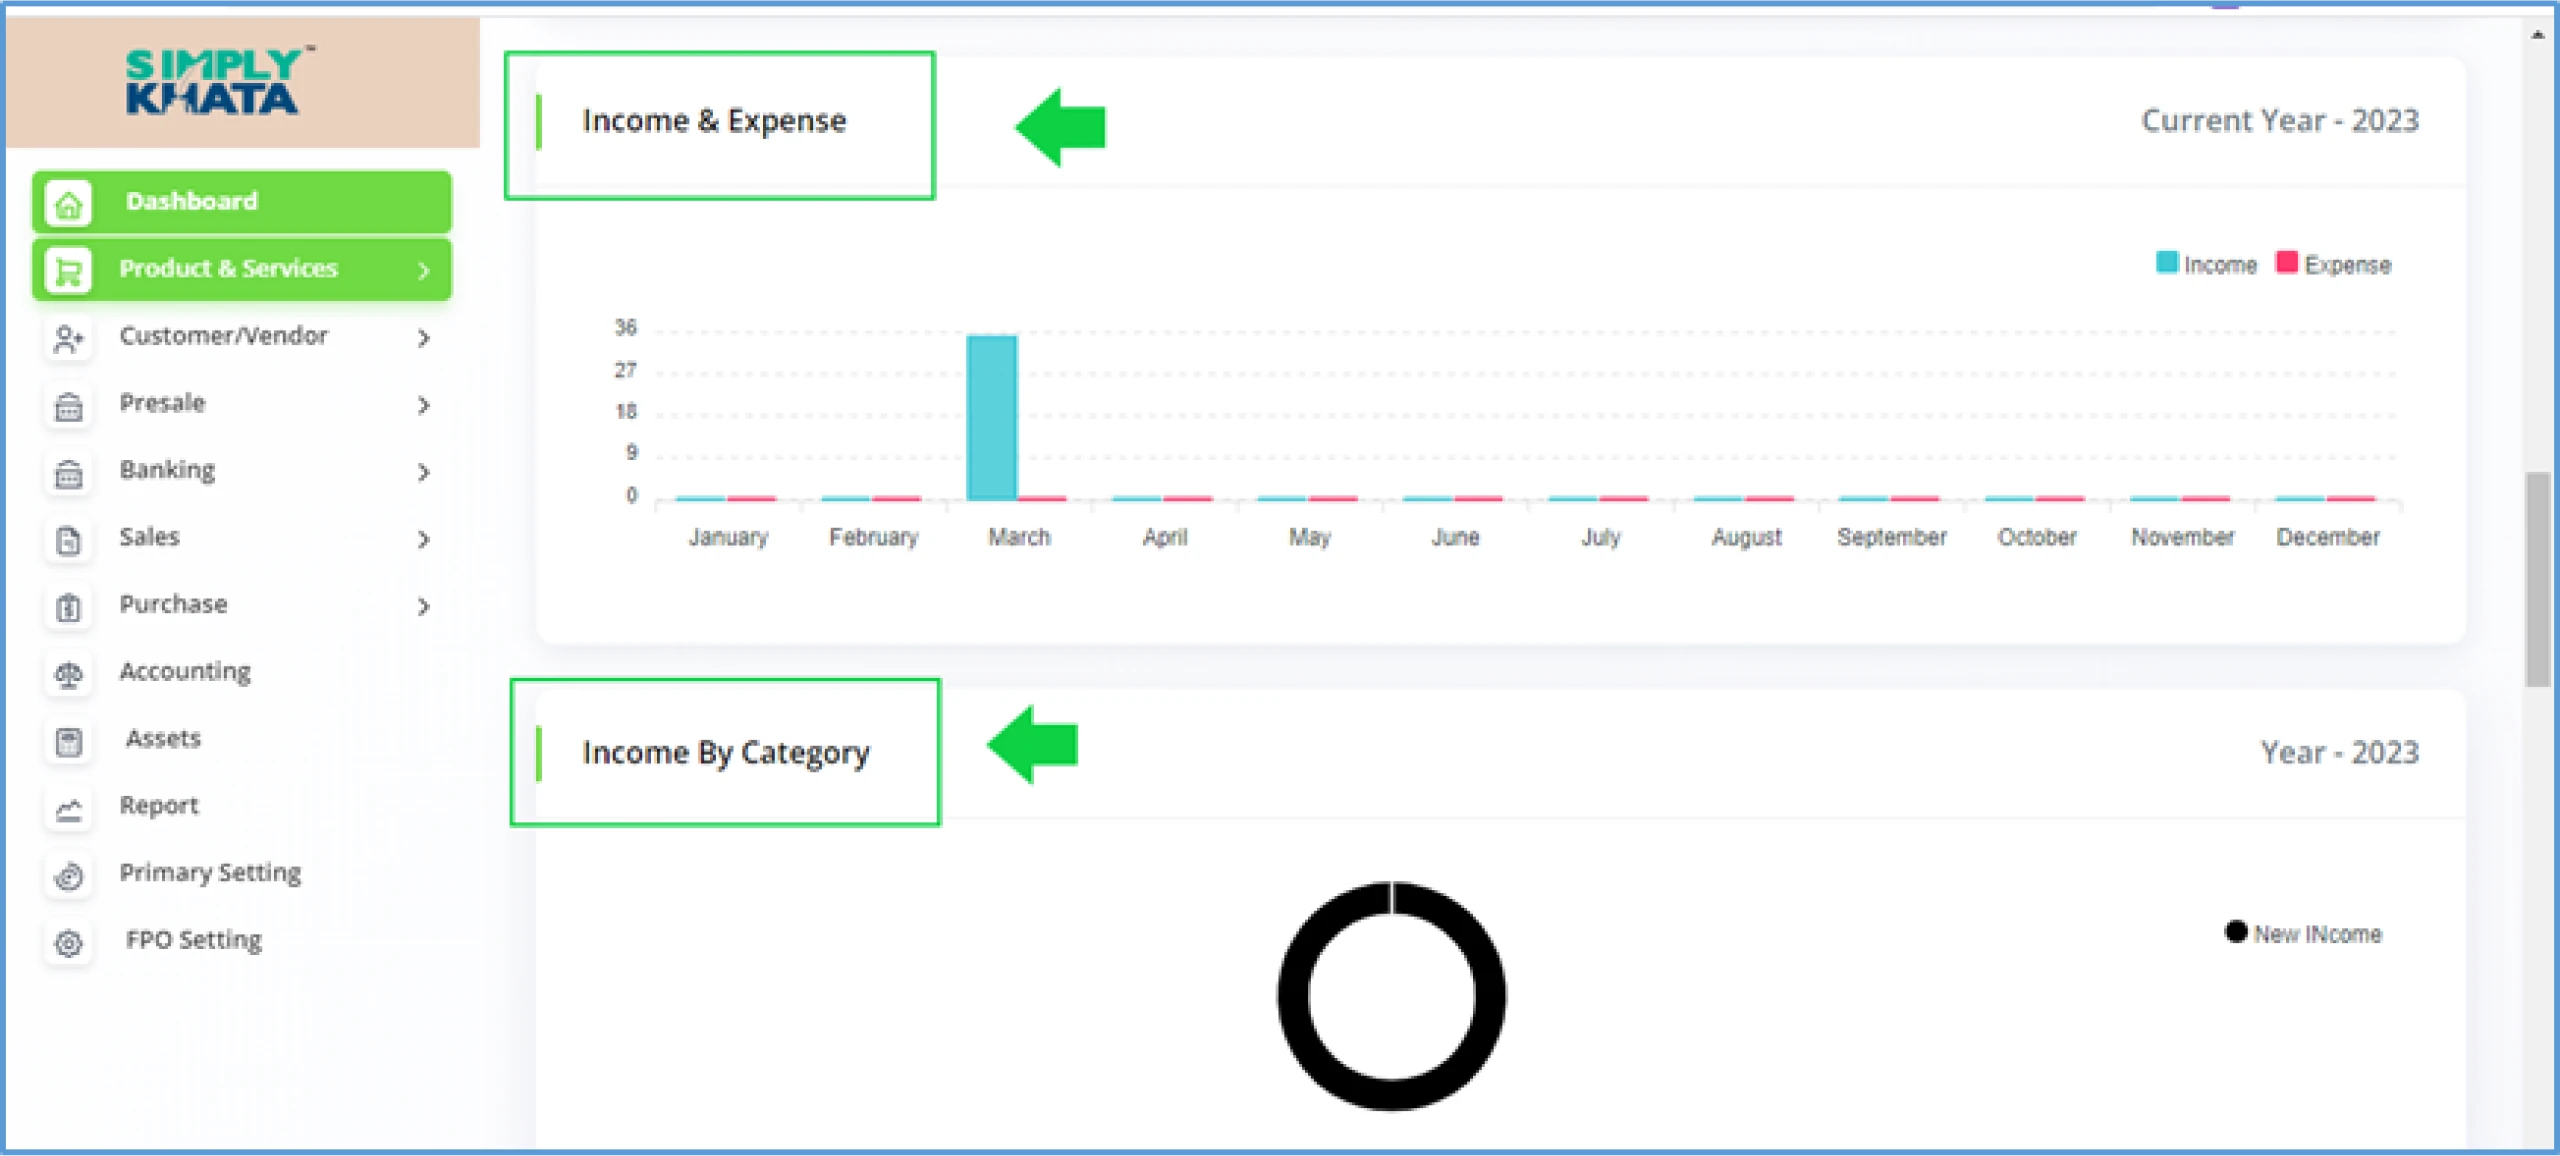
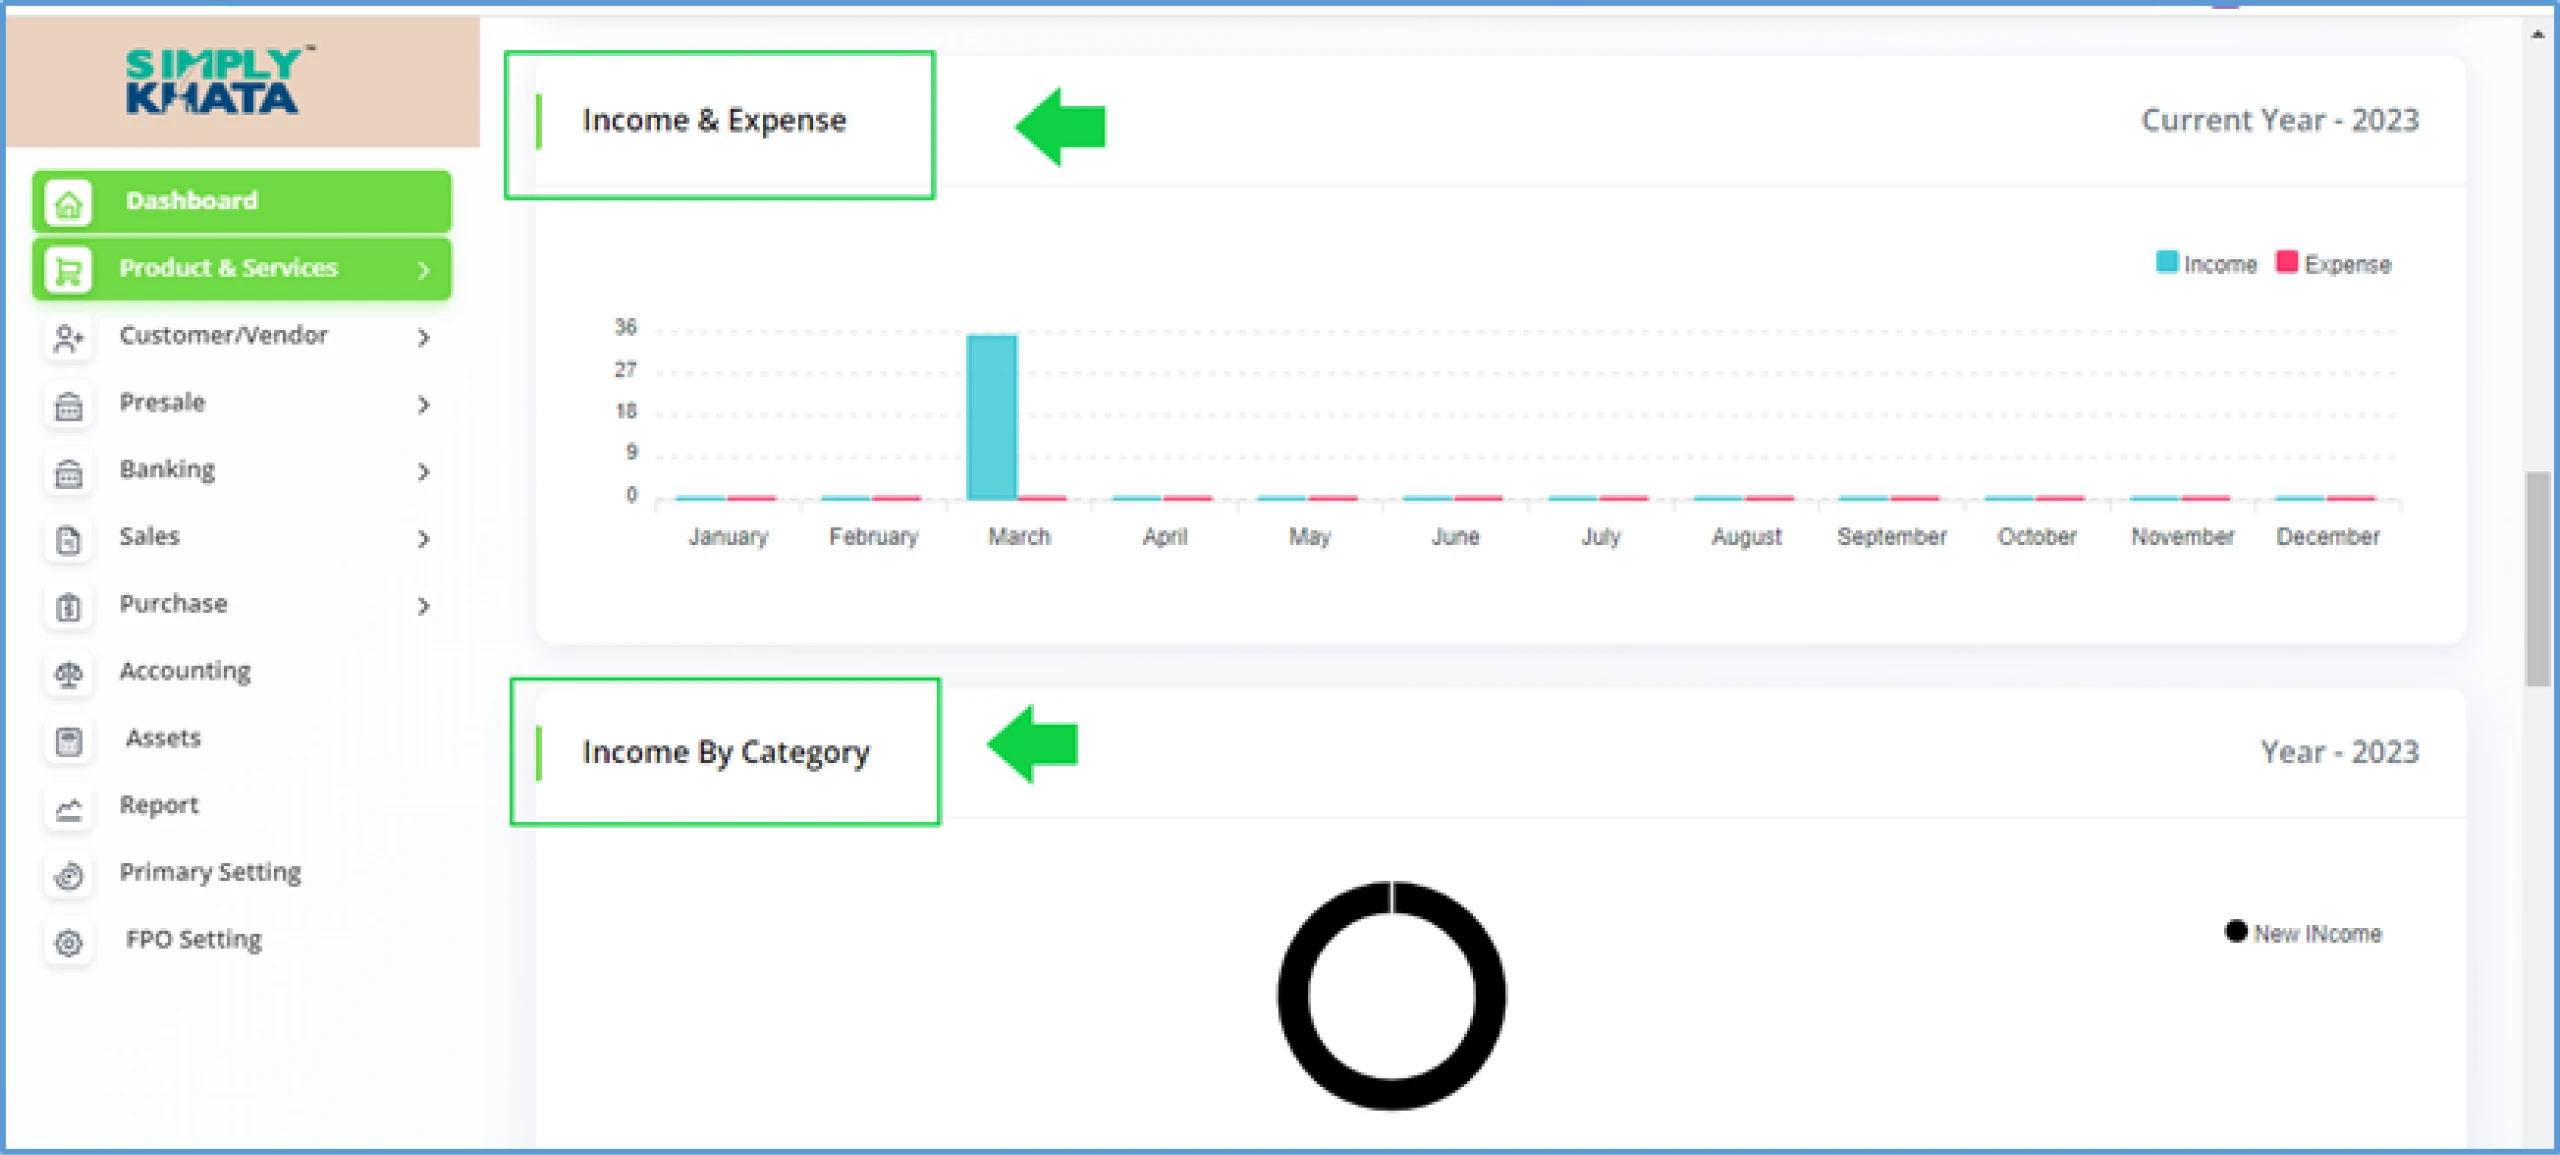
c. Dashboard: 5th & 6th Section> Income & Expense, Incomeby Category
These sections give information about Income and expenses (Month wise comparative)
and about the Income value by category on a Yearly basis (Current Year) as per Image 20.
These summary points (Cumulative) are available for daily and for current month.
The graphs also has legends for value display. For Income Donut Graph is given,
this graph shows all the Income categories for Income share view
(Image -20)
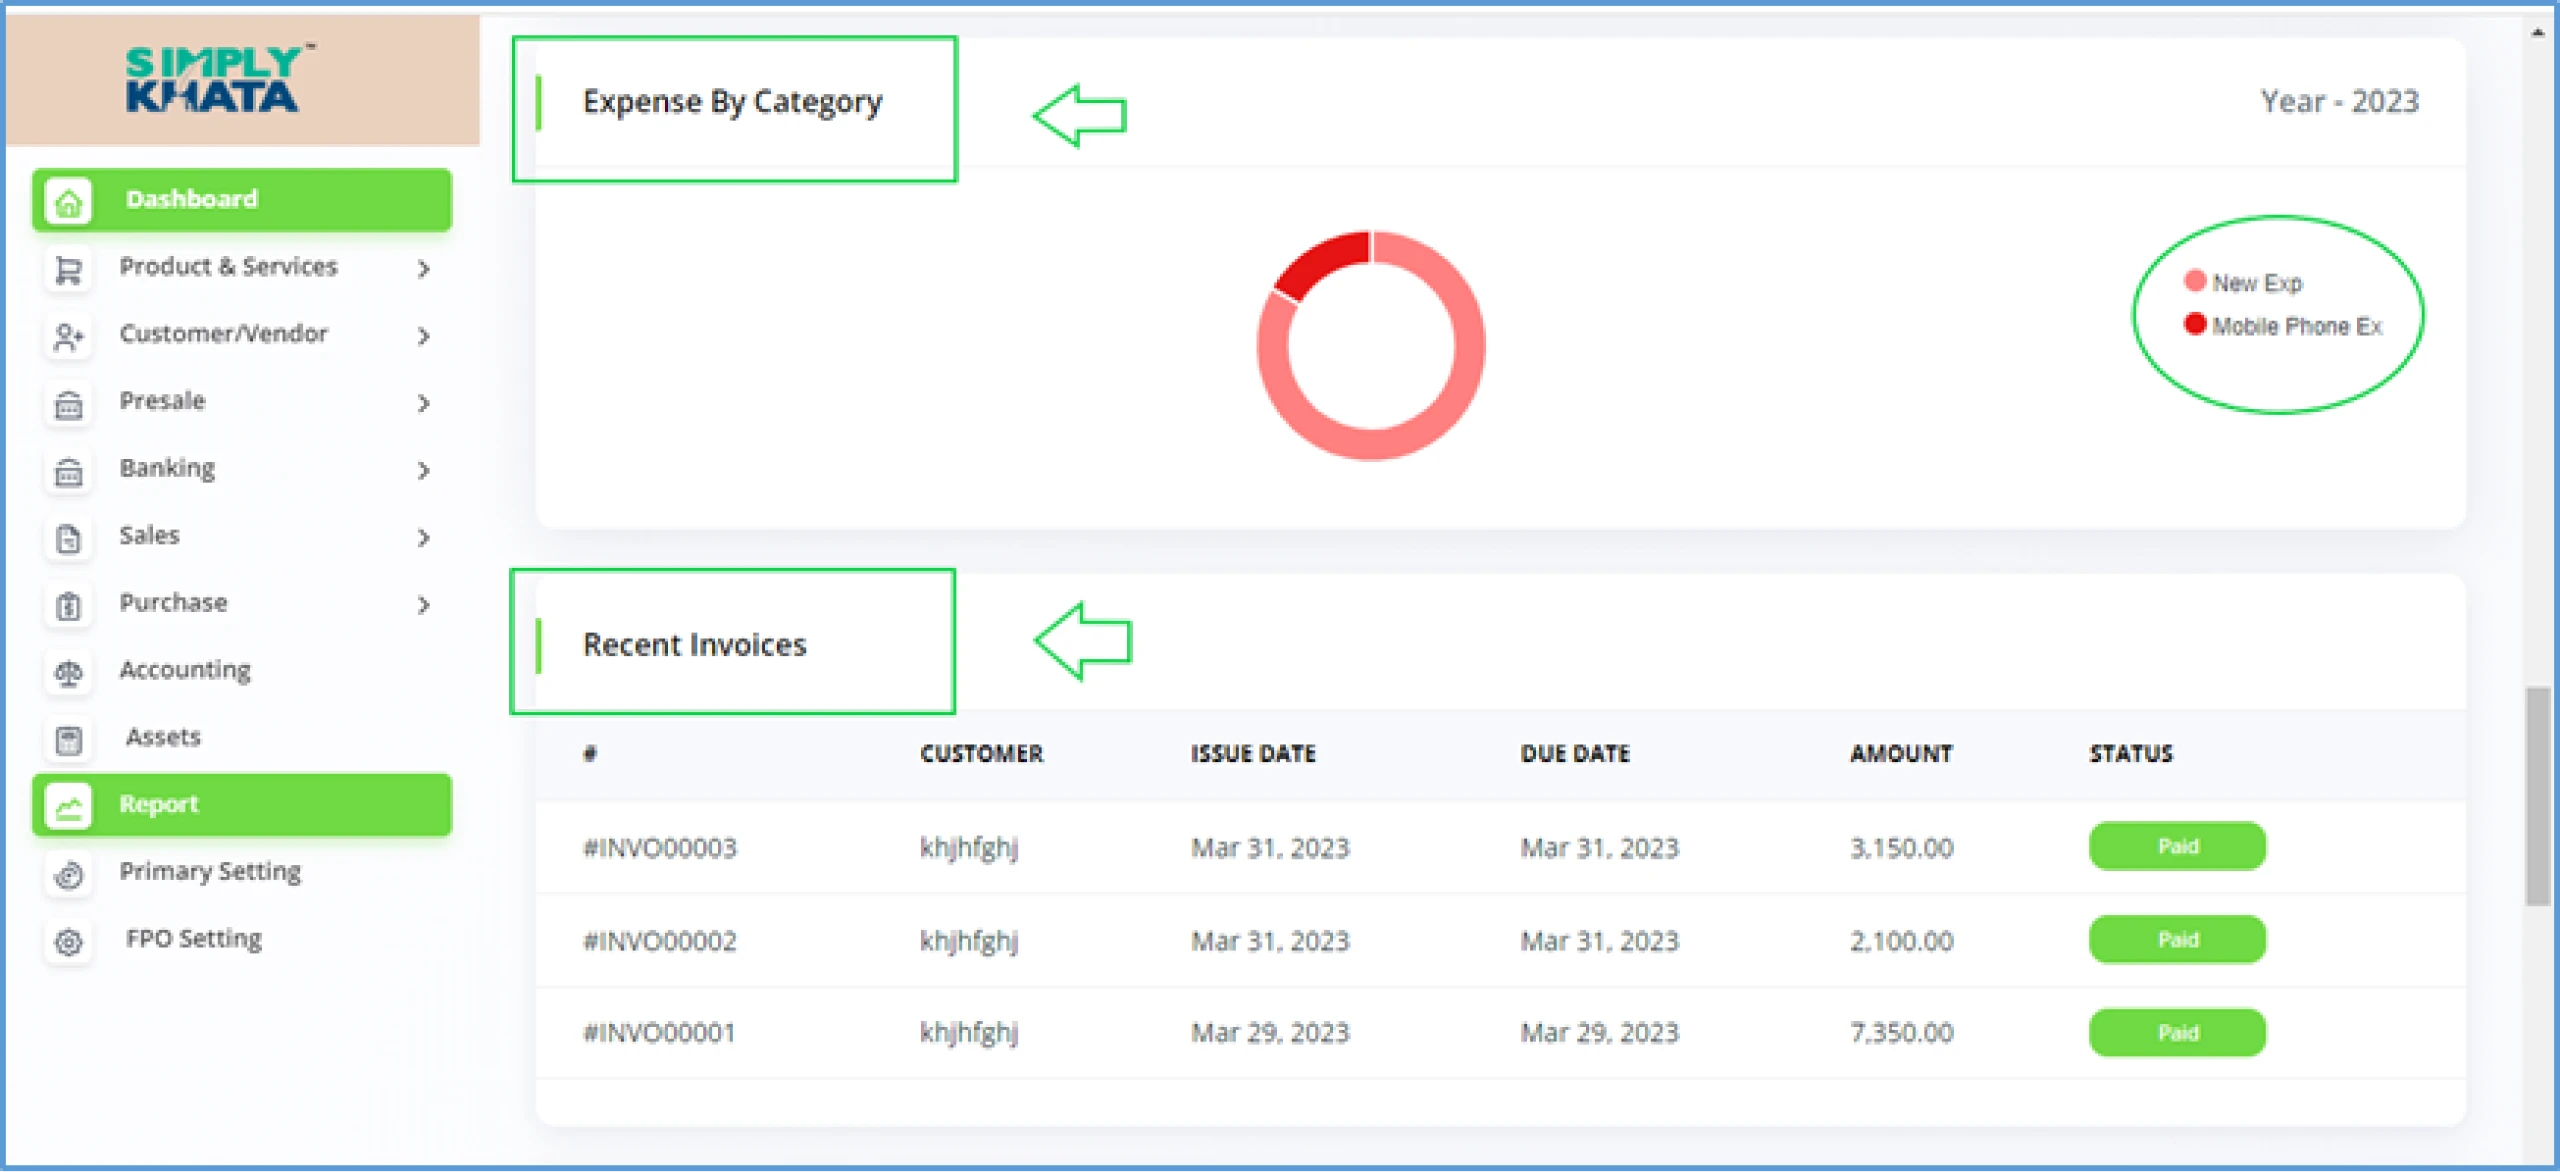
d. Dashboard: 7th & 8th Section> Expense by Category and Recent Invoices
These sections give information about Expenses by category on a Yearly basis (Current Year) as per Image 21.
For Expenses Donut Graph is given, this graph shows all the Expenses categories for Expenses category share view.
The Donut graphs also has legends for value display.
Invoice section (8th) gives information in the list format related to the Recent Invoices Issued.
This list displays the amount and status of the invoices for decision making.
(Image -21)
e. Dashboard: 9th Section> Invoice statistics weekly and Monthly
This section gives user the summarised information about the invoices issued on a weekly and monthly basis.
This gives total monthly invoices and the total amount of those invoices it also provides the summary of the
Paid and Due amount. The same data summary is available for the entire week also (Image – 22).

(Image -22)
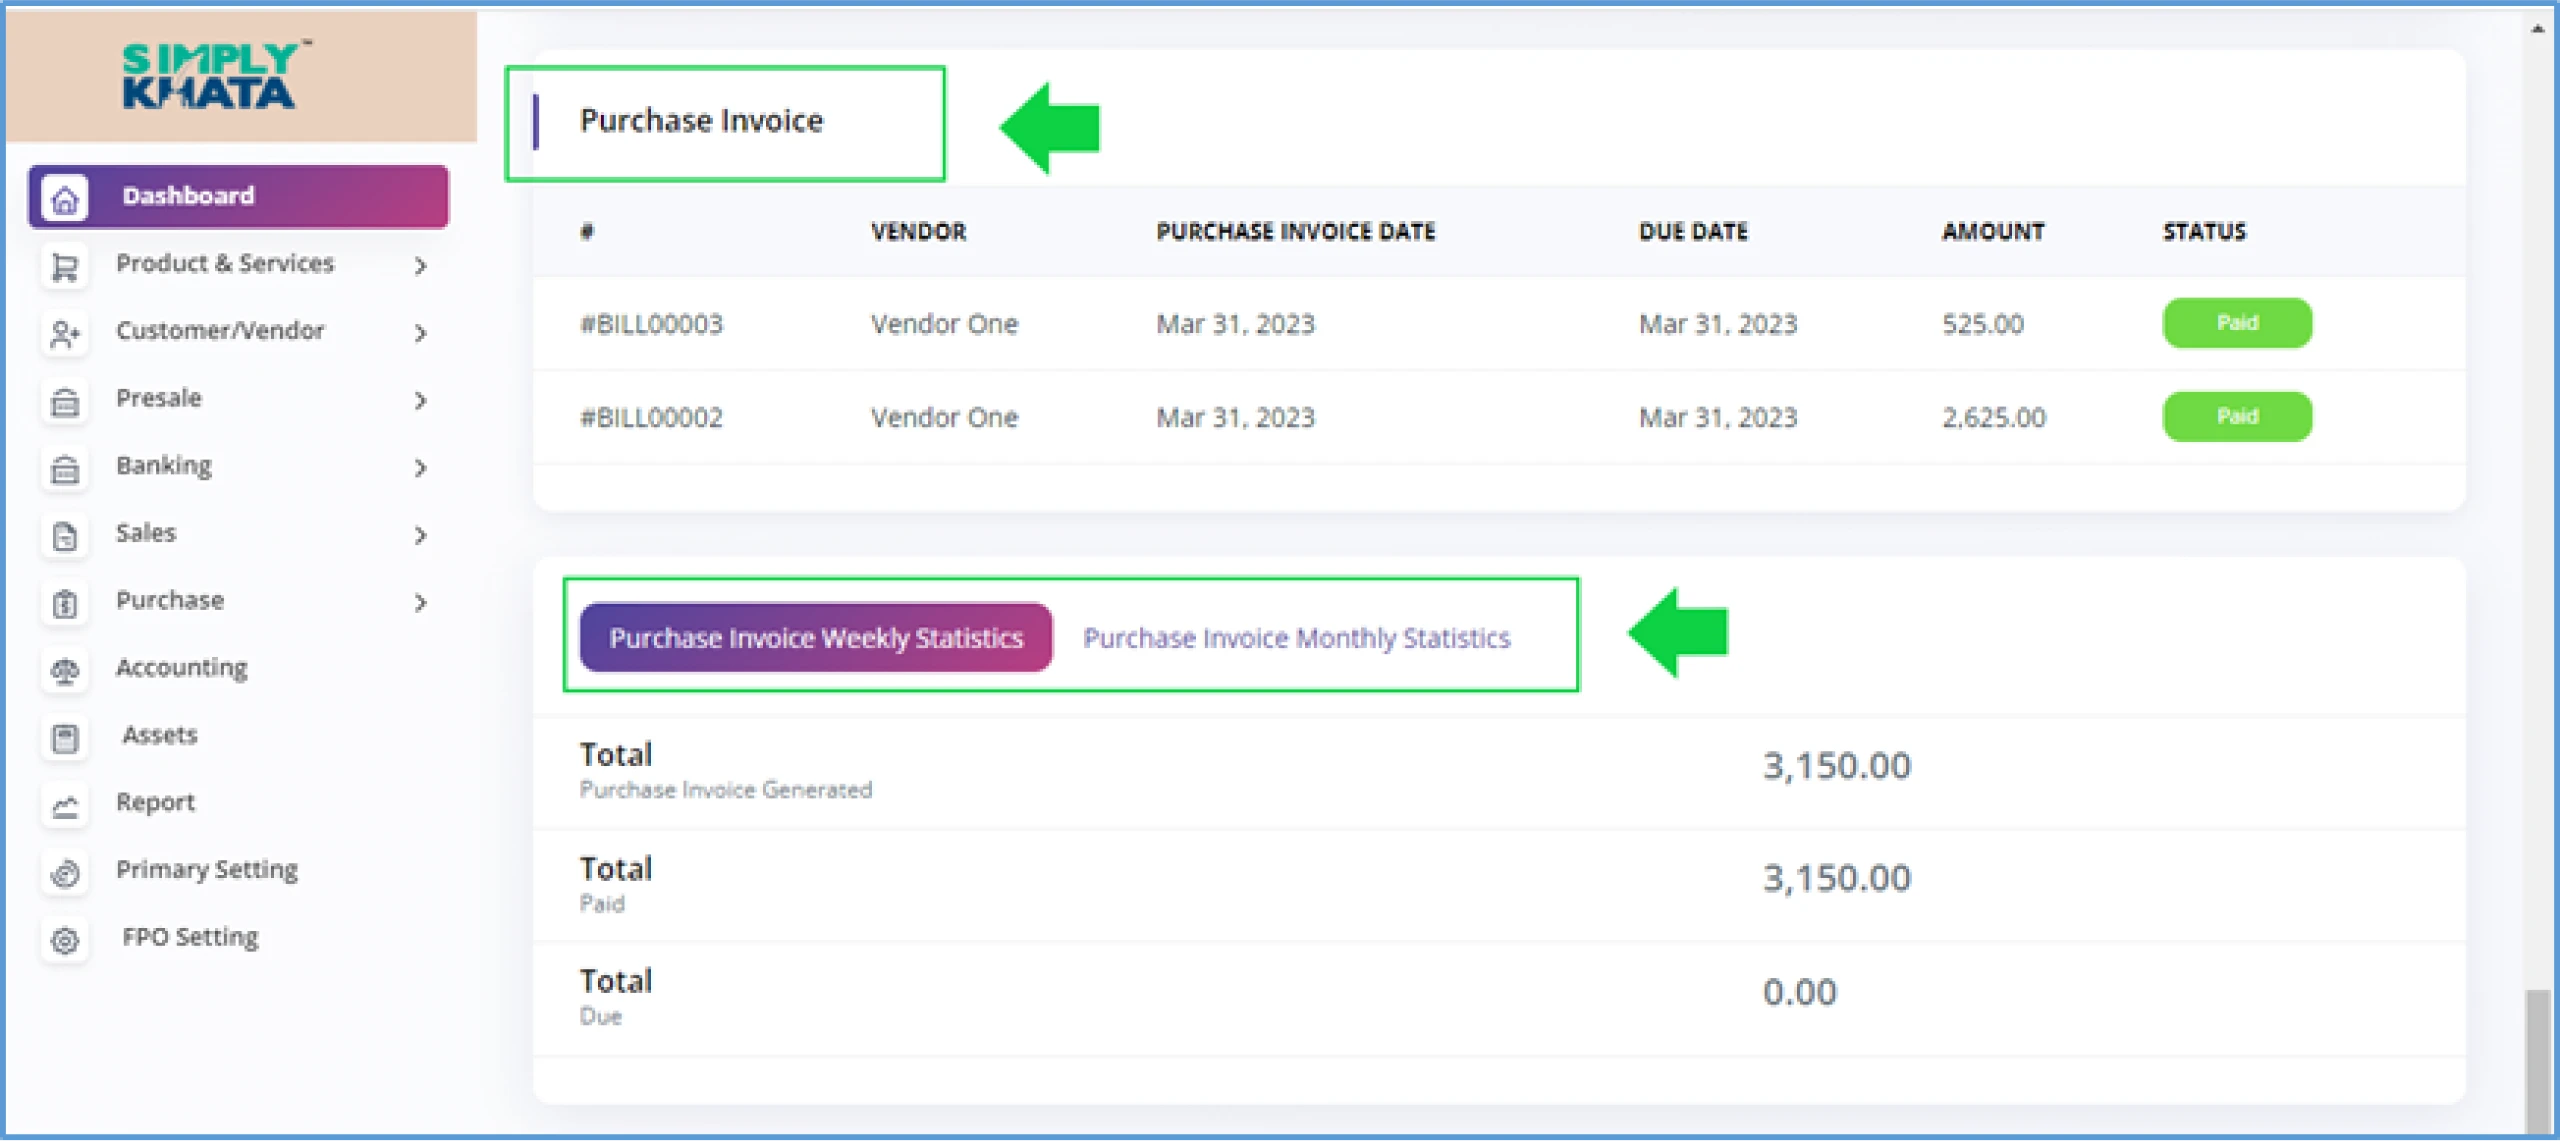
f. Dashboard: 10th and 11th Section > Purchase Invoice listand statistics
Purchase Invoice section (10th) gives information in the list format related to the Recent Purchase Invoices Issued.
This list displays the amount and status of these Purchase invoices for decision making.
This section gives user the summarised information about the Purchase invoices issued on a weekly and monthly basis.
This gives total monthly Purchase invoices and the total amount of those invoices,
it also provides the summary of the Paid and Due amount.
The same data summary is available for the entire week also (Image – 23).
The weekly and monthly Purchase invoice section can be accessed by clicking the respective tabs of the section.
(Image -23)
This is the first view, which is visible as the user logs in to the system, this screen has multiple data Indicators divided into sections.
a. Dashboard: 1st and 2nd Section > Summary & Account Balance
This 1st section gives information about the main indicators of the business like how many customers and Vendors FPO has.
- Customers > Number of Customers, The FPO has
- Vendors > Number of Vendors, The FPO has
- Invoices > Number of Invoices, The FPO issued
- Purchase Invoices > Number of Purchase Invoices, The FPO issued
This 2nd Section gives information about the bank account mapped in the system. This section can contain multiple bank account details for summary view (Image - 18).

(Image -18)
b. Dashboard: 3rd & 4th Section> Cash-flow & Incomevs Expense
These sections give information about the cash flow of the FPO and income vs expenses. These summary points (Cumulative) are available for daily and for current month.

(Image -19)
c. Dashboard: 5th & 6th Section> Income & Expense, Incomeby Category
These sections give information about Income and expenses (Month wise comparative) and about the Income value by category on a Yearly basis (Current Year) as per Image 20. These summary points (Cumulative) are available for daily and for current month. The graphs also has legends for value display. For Income Donut Graph is given, this graph shows all the Income categories for Income share view

(Image -20)
d. Dashboard: 7th & 8th Section> Expense by Category and Recent Invoices
These sections give information about Expenses by category on a Yearly basis (Current Year) as per Image 21. For Expenses Donut Graph is given, this graph shows all the Expenses categories for Expenses category share view. The Donut graphs also has legends for value display. Invoice section (8th) gives information in the list format related to the Recent Invoices Issued. This list displays the amount and status of the invoices for decision making.

(Image -21)
e. Dashboard: 9th Section> Invoice statistics weekly and Monthly
This section gives user the summarised information about the invoices issued on a weekly and monthly basis. This gives total monthly invoices and the total amount of those invoices it also provides the summary of the Paid and Due amount. The same data summary is available for the entire week also (Image – 22).

(Image -22)
f. Dashboard: 10th and 11th Section > Purchase Invoice listand statistics
Purchase Invoice section (10th) gives information in the list format related to the Recent Purchase Invoices Issued. This list displays the amount and status of these Purchase invoices for decision making.
This section gives user the summarised information about the Purchase invoices issued on a weekly and monthly basis. This gives total monthly Purchase invoices and the total amount of those invoices, it also provides the summary of the Paid and Due amount. The same data summary is available for the entire week also (Image – 23).
The weekly and monthly Purchase invoice section can be accessed by clicking the respective tabs of the section.
